Empowering farmers by bringing together all the players of agriculture ecosystem on a digital platform.

The Agriculture industry serves as a source of employment for over half of India’s population. And farmers, upon whose shoulders this sector thrives, lives in dire situation.
Lollypop researched on-field with the farmers community to understand their real pain points; which included gathering insights regarding demographic trends, literacy levels, and technological exposure.
The research yielded three key factors as being responsible for the woes of farmers that could be successfully alleviated through digital design. This comprised a contextually-aligned solution that’s custom built to fit usability standards of farmers, which democratized the marketplace through simplification agricultural value chains.
Agriculture is the primary source of livelihood for nearly 58% of India’s population. The contribution of agriculture, and agricultural activity accounted for 17.32% of the national Gross Domestic Product (GDP) in the fiscal year 2016-17.
A majority share of the contribution to India’s magnanimous agriculture sector, comes from a handful of States; also known as primary agriculture States. These are Punjab, Uttar Pradesh, Madhya Pradesh, Haryana, Bihar, Andhra Pradesh, Maharashtra, West Bengal and Gujarat.
Despite the fact that farmers carry as crucial an industry as agriculture on their shoulders; majority of them end up with returns that are far from viable.
NSS Report

We interviewed 158 farmers from across Maharashtra, and Karnataka. The major aspects of our study to help us design the experience included:
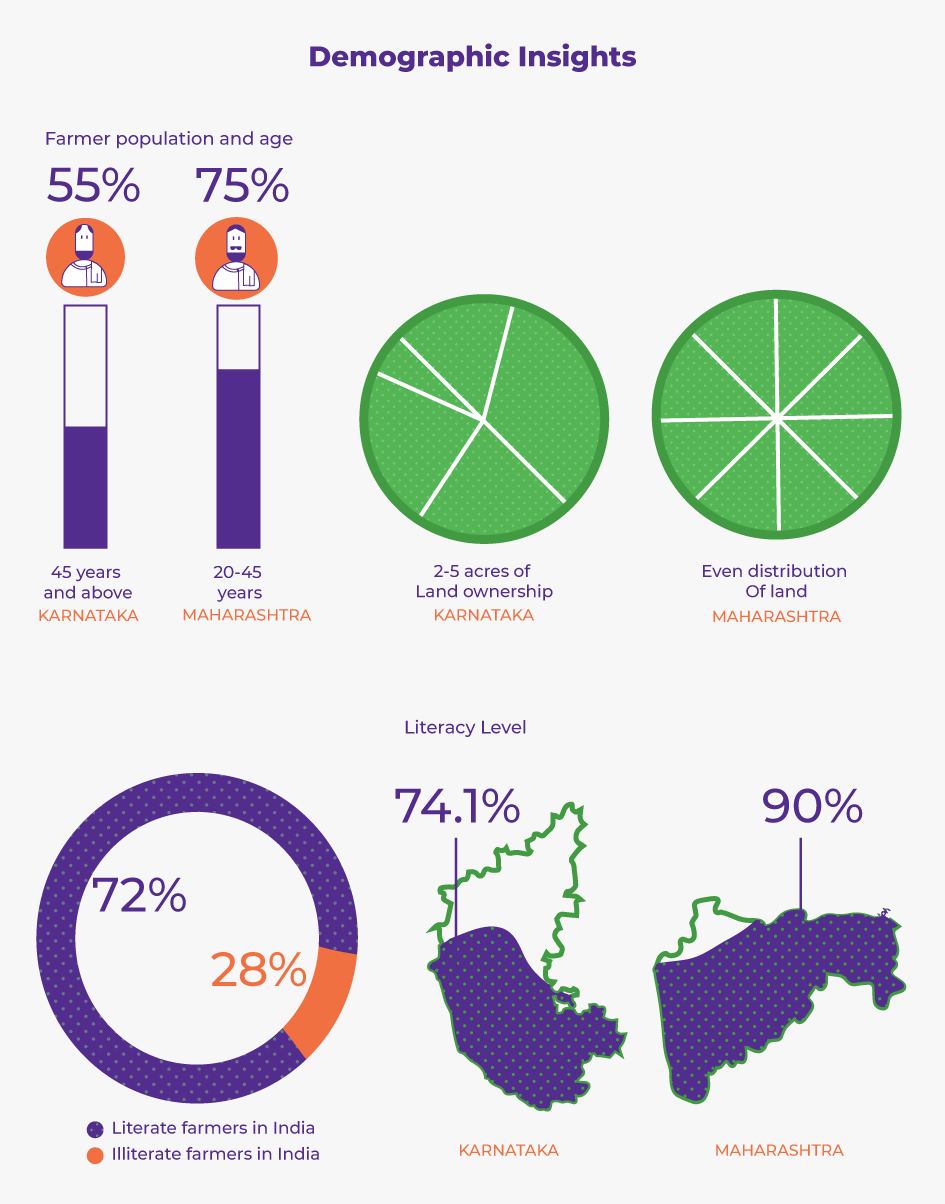
In Karnataka we found that over 55% of the farmer population was aged 45 years, and above. The scenario in Maharashtra however, was quite the opposite, with over 70% farmers belonging to the younger age group of 20-45 years of age.
There were similar trends of disparity even when it came to land ownership–Maharashtra had a more or less even distribution, while most farmers in Karnataka owned between 2, and 5 acres of land.
Based on our sample research, we found that the literacy rate among farmers is quite high in the State of Maharashtra; with over 90% of the total number being literate. Karnataka had a relatively lower literacy rate; standing at 74.1% of the total number.
Research shows that 7 out of every 10 farmers in India have mobile phones, and 1 in every 2 farmer households sometimes more own a television. This indicates that mobile, as well as multimedia penetration among farmers is well above average.

Currently, 70% of individuals in rural areas access the internet via their mobile phones. Furthermore, smartphone usage trends are higher in Maharashtra encompassing 60% of all farmers as opposed to 42.2% in Karnataka. As far as service providers are concerned, farmers in Karnataka (approx. 45%) prefer to use Airtel network; while their Maharashtrian counterparts (approx. 69%) are inclined towards Idea.
Furthermore, only a fraction–approximately 10%–of these individuals make use of PCs, and laptops.
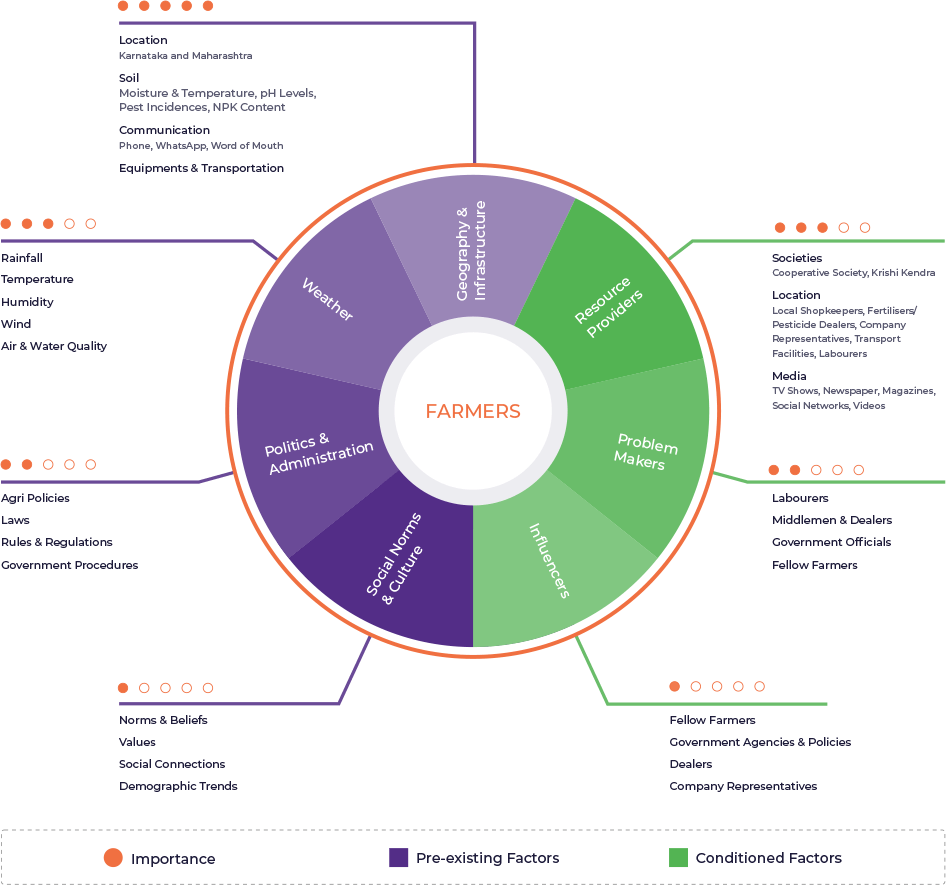
Through our research, we concluded that farmers do not operate as individual entities, but rather as components of a complex ecosystem; wherein exist numerous environmental, physical, and psychosocial elements that impact the respective decision-making processes.
The dictionary defines an ecosystem as “an ecological community together with its environment, functioning as a unit”; a definition we applied to the farmer’s environment. Based on this, we were able to postulate that the farmer ecosystem functions as a collective result of the pivotal effect each individual farmer has on it.
In order to gain a holistic understanding of the farmer’s ecosystem, we implemented a process known as Ecosystem Mapping. An ecosystem map is a visual representation of a farmers’ network; that depicts all key members, such as buyers, dealers, distribution channels, and influencers, and graphically represents the relationships that they share.